Vexplot

Precise math diagrams, made directly in your browser.

Vexplot is a set of simple visual tools for creating coordinate graphs, charts, and angle diagrams. Build clean SVG-based visuals, adjust the details, and export them for worksheets, lessons, notes, or presentations.

12345671234OA(1, 1)B(2, 2)C(4, 1)D(6, 4)
0510152025JanFebMar
65°?120°ef98°

Vexplot keeps the controls close to the canvas, giving you a clear workflow without the overhead of a large design or charting suite.

Local savingSVG exportPNG export

Choose a tool

One focused workspace for each visual.

Start with the visual you need, then refine every important detail without leaving the canvas.

12345671234OA(1, 1)B(2, 4)C(3, 1)D(4, 4)

Coordinates

Graph Editor

Create coordinate-plane diagrams with configurable axes, grid lines, points, line segments, and labels.

Useful for

  • Plot points on a coordinate grid
  • Draw line segments
  • Create classroom graph examples
  • Export clean graph visuals
Open Graph Editor
051015202530JanFebMarAprMaySeries 1Series 2

Data

Chart Maker

Create categorical bar charts and line charts with editable categories, series, colours, labels, legends, and axis settings.

Useful for

  • Build single or grouped bar charts
  • Create single or multi-line charts
  • Compare simple datasets
  • Export presentation-ready graphics
Open Chart Maker
104°

Geometry

Angle Maker

Create single, split, and full-circle multi-angle diagrams with editable measurements, rays, labels, markers, and layouts.

Useful for

  • Draw single angle diagrams
  • Divide angles into labelled parts
  • Build multi-angle diagrams around a point
  • Arrange multiple diagrams on one canvas
Open Angle Maker

Tool previews

See the editing workspaces before you jump in.

Explore the actual Graph Editor, Chart Maker, and Angle Maker layouts, along with the core features available inside each workspace.

Coordinate diagrams

Plot points and connect them with styled line segments.

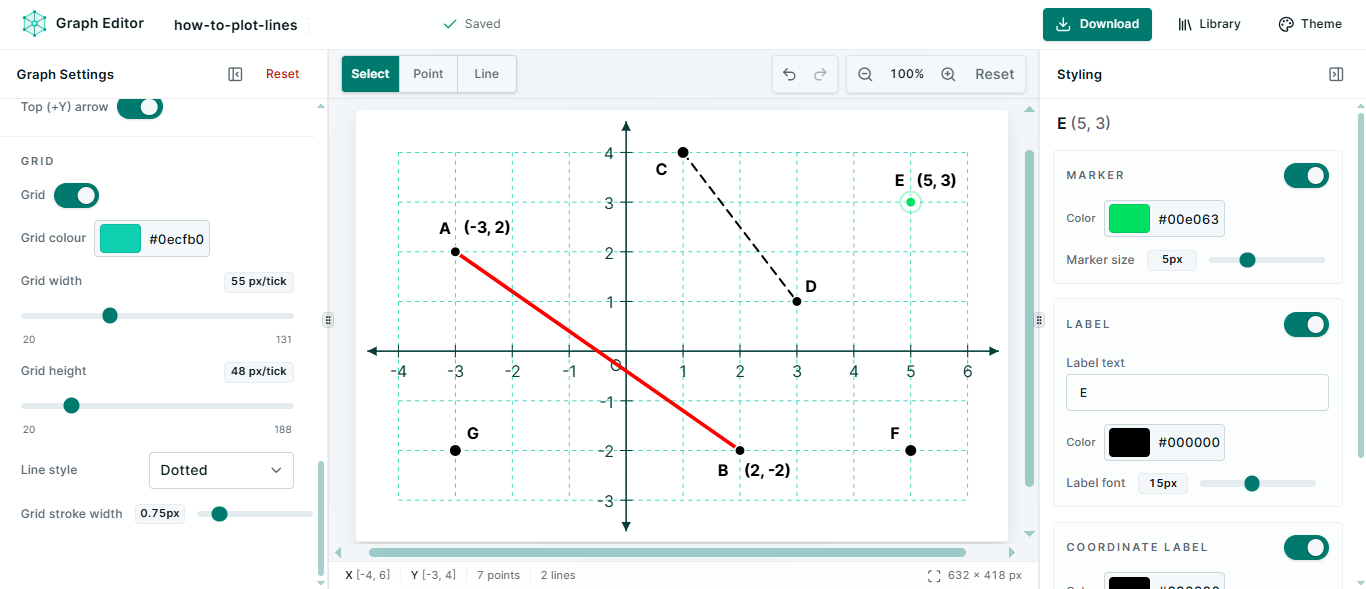
Build coordinate-plane visuals while keeping the grid settings, plotted objects, canvas, and style inspector visible together.

  • Editable axis ranges and grid spacing
  • Labelled points and coordinate labels
  • Solid, dashed, or dotted segments
  • Independent point and line styling
Explore Graph Editor
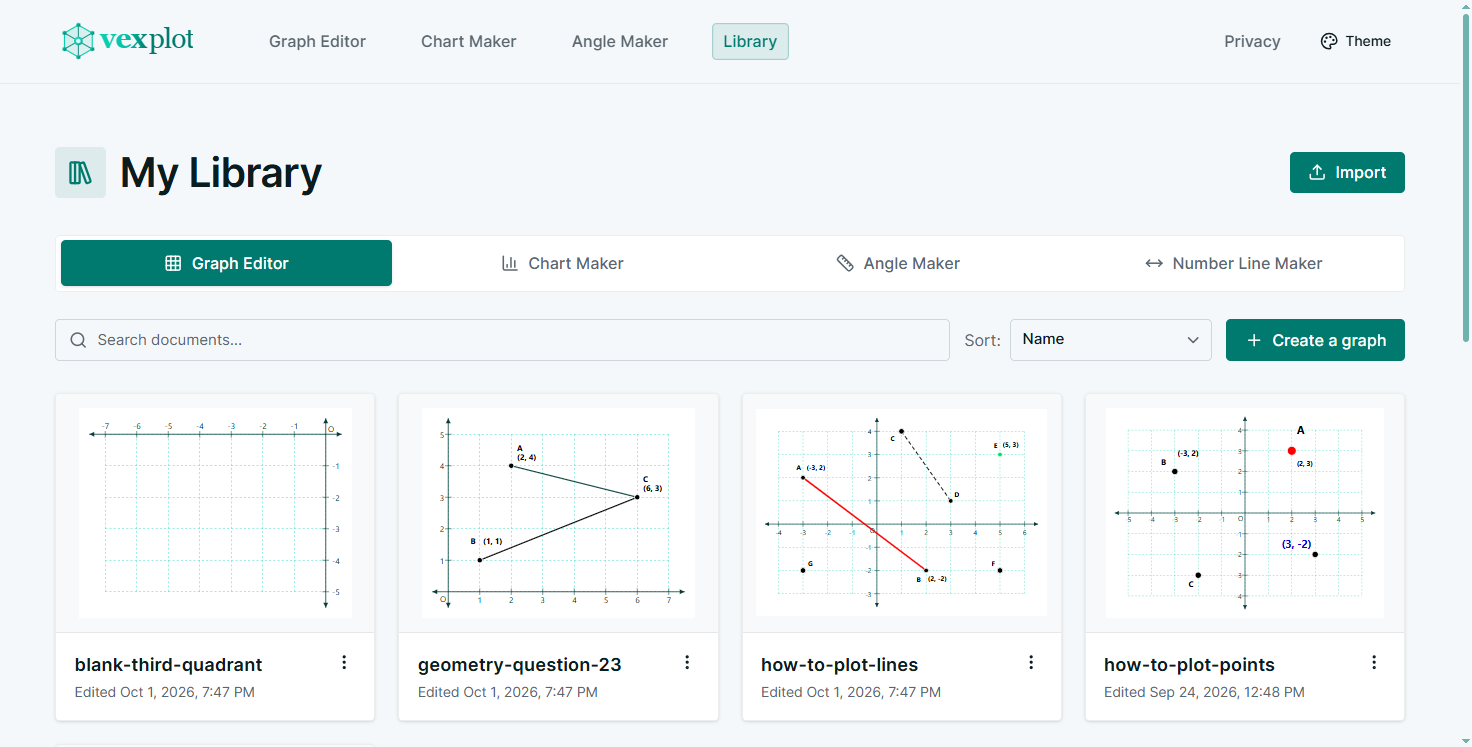
Graph Editor workspace showing individually styled labelled points on a coordinate grid

Graph Editor

1 / 2

Plot and style labelled points

Place points on grid intersections, then control marker colours, names, coordinate labels, and label positioning.

Categorical data

Use one editable dataset across four chart layouts.

Move between single and multi-series bar or line charts without re-entering categories and values.

  • Single and grouped bar charts
  • Single and multi-line charts
  • Up to 12 categories and 4 series
  • Editable labels, legends, axes, and colours
Explore Chart Maker
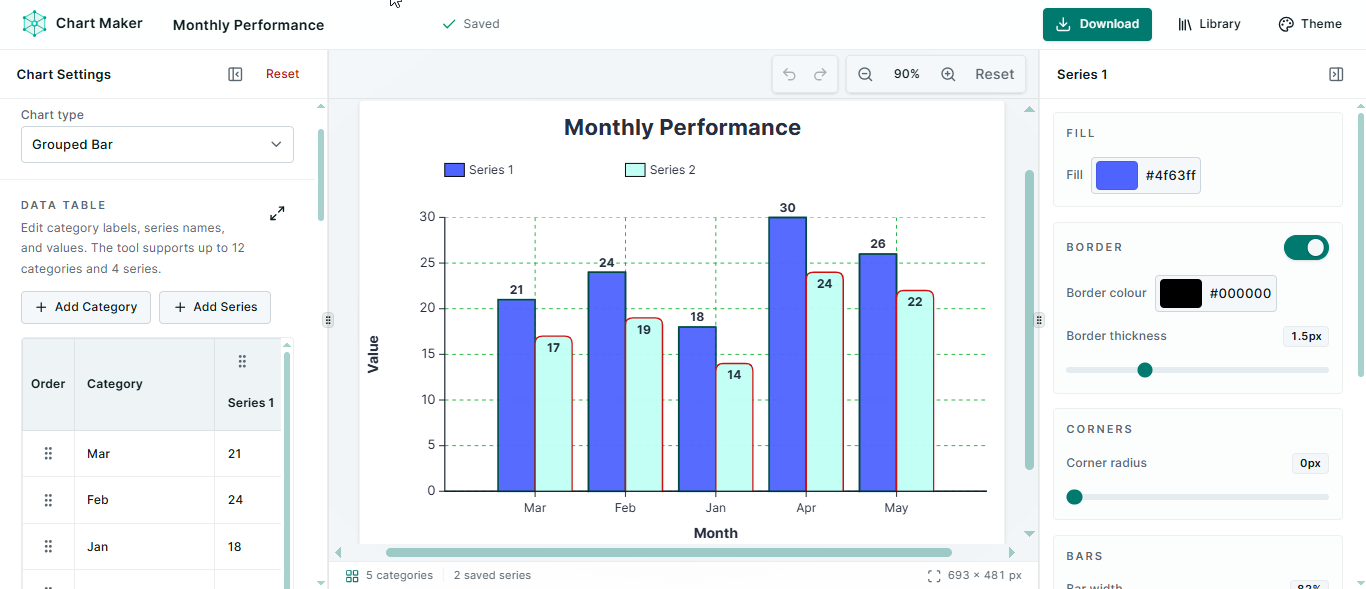
Chart Maker workspace showing a single-series categorical bar chart

Chart Maker

1 / 4

Single-series bar charts

Turn one set of category values into a focused comparison with editable axes, labels, spacing, colours, and value display.

Geometry diagrams

Create single, split, and full-circle angle visuals.

Work with one measured angle, adjacent subdivisions, or sectors around a shared vertex, then arrange multiple diagrams on one canvas.

  • Single, split, and multi-angle modes
  • Clockwise or anticlockwise direction
  • Independent sub-angle markers and labels
  • Row, column, and grid canvas layouts
Explore Angle Maker
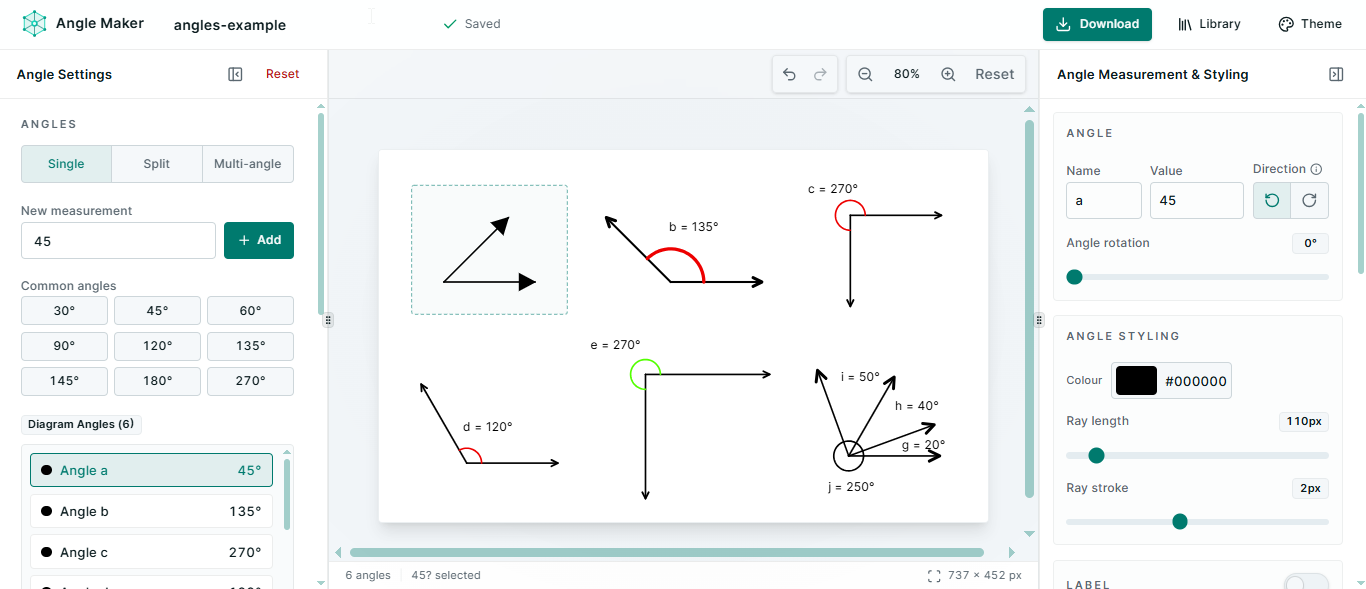
Angle Maker workspace showing one editable 145 degree angle

Angle Maker

1 / 3

Single measured angles

Create one focused angle with an editable measurement, direction, rotation, rays, marker, arrows, and draggable label.

Why Vexplot

The controls you need. Nothing in the way.

Clear tools for people who need accurate mathematical visuals without setting up a larger design workflow.

Focused tools

Each tool is built around one mathematical visual, so the interface stays practical and direct.

SVG-based output

The preview is rendered as SVG, keeping lines, labels, and diagrams sharp at any size.

Editable settings

Adjust labels, colours, spacing, strokes, axes, markers, and layout without starting again.

Browser-based workflow

There is no account setup for the core workflow, and your tool state stays on your device.

Export

Export diagrams when you need them.

Create your visual, check it on the canvas, then export it for teaching materials, documents, websites, or presentations.

SVGSharp at any size
PNGReady to place

Workflow

Create, adjust, export.

  1. 1Choose the tool that matches the visual you need.
  2. 2Add your data, points, or angle measurements.
  3. 3Adjust the layout and styling.
  4. 4Export the finished visual as SVG or PNG.

Made for real teaching work.

From a quick example to a finished resource, use the same clear visual wherever it needs to go.

Maths worksheetsLesson slidesRevision notesOnline learning resourcesAssessment questionsSimple data visualsGeometry examples

Start with the tool you need

Create a clear visual, then export it.

Create a graph, chart, or angle diagram directly in the browser and export it when it is ready.

Explore tools

FAQ

A few useful answers.

The essentials about creating, saving, and exporting with Vexplot.

What can I create with Vexplot?

You can create coordinate graphs, categorical bar and line charts, and single, split, or full-circle multi-angle diagrams. Each tool includes controls designed specifically for that type of visual.

Do I need an account or an installation?

No. Vexplot runs directly in your browser, and the core editing workflow does not require an account or software installation.

Where is my work saved?

Your recent tool state is stored locally in your browser. You can return to it on the same browser and device, but it is not synced between devices.

Which export formats are available?

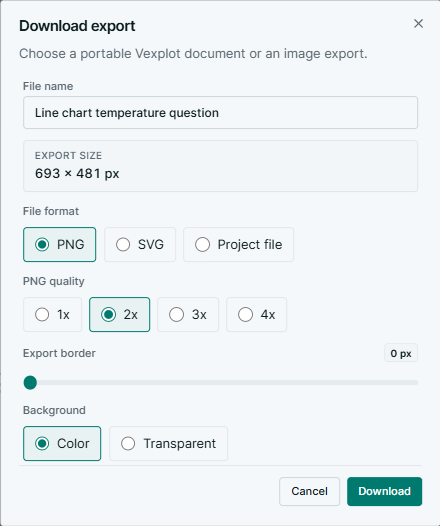
Every tool can export SVG and PNG files. SVG is ideal when you need a sharp, scalable visual; PNG is useful for quickly placing an image in a document or slide.

Can I use exported diagrams in teaching materials?

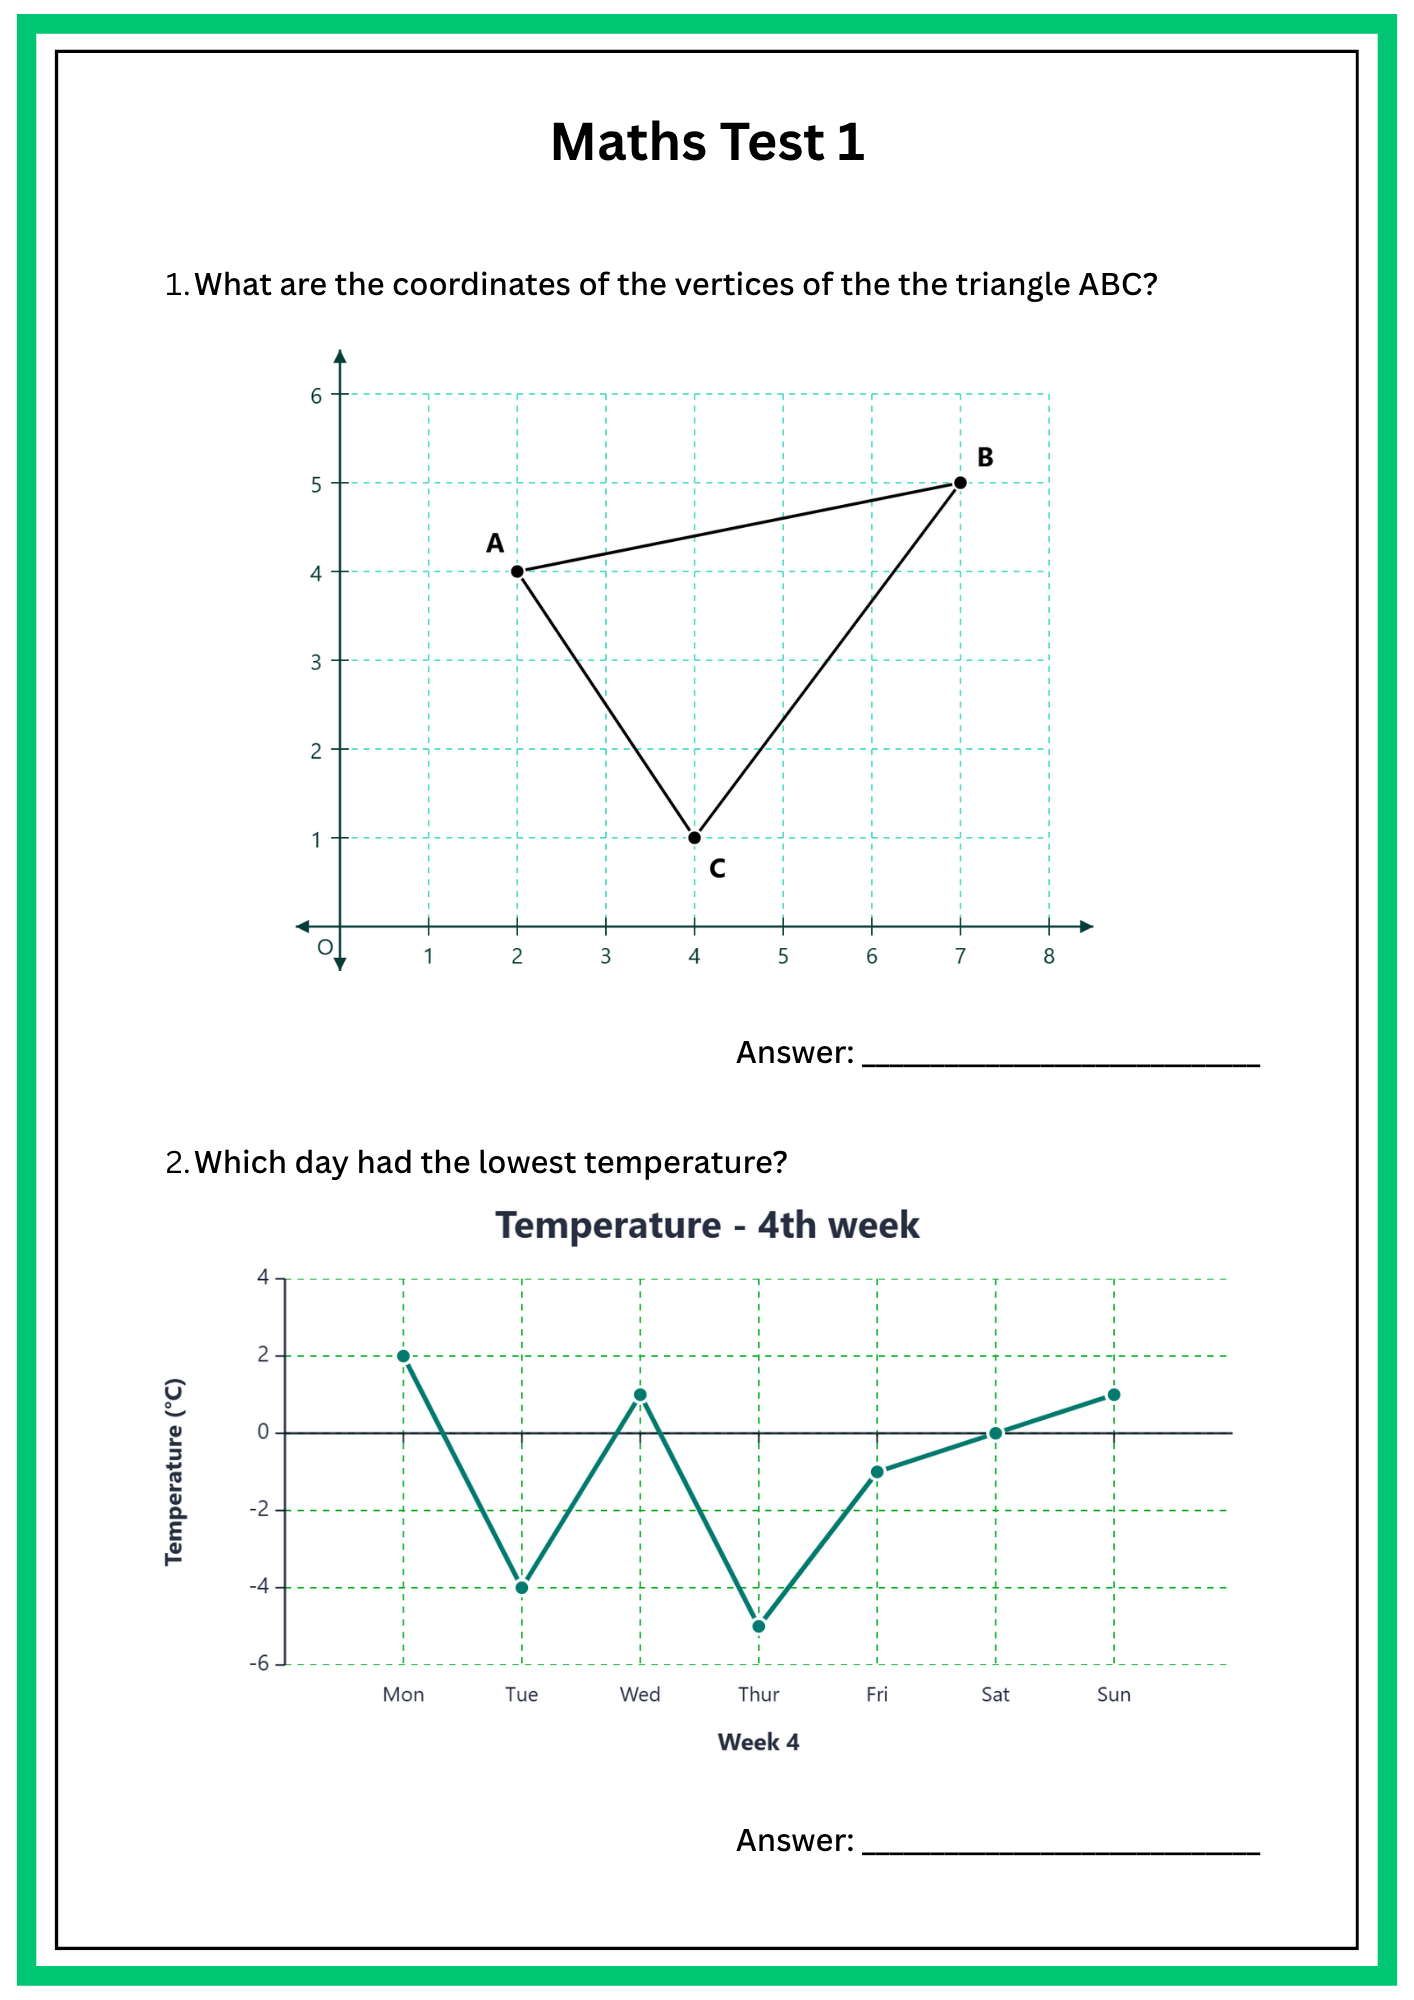
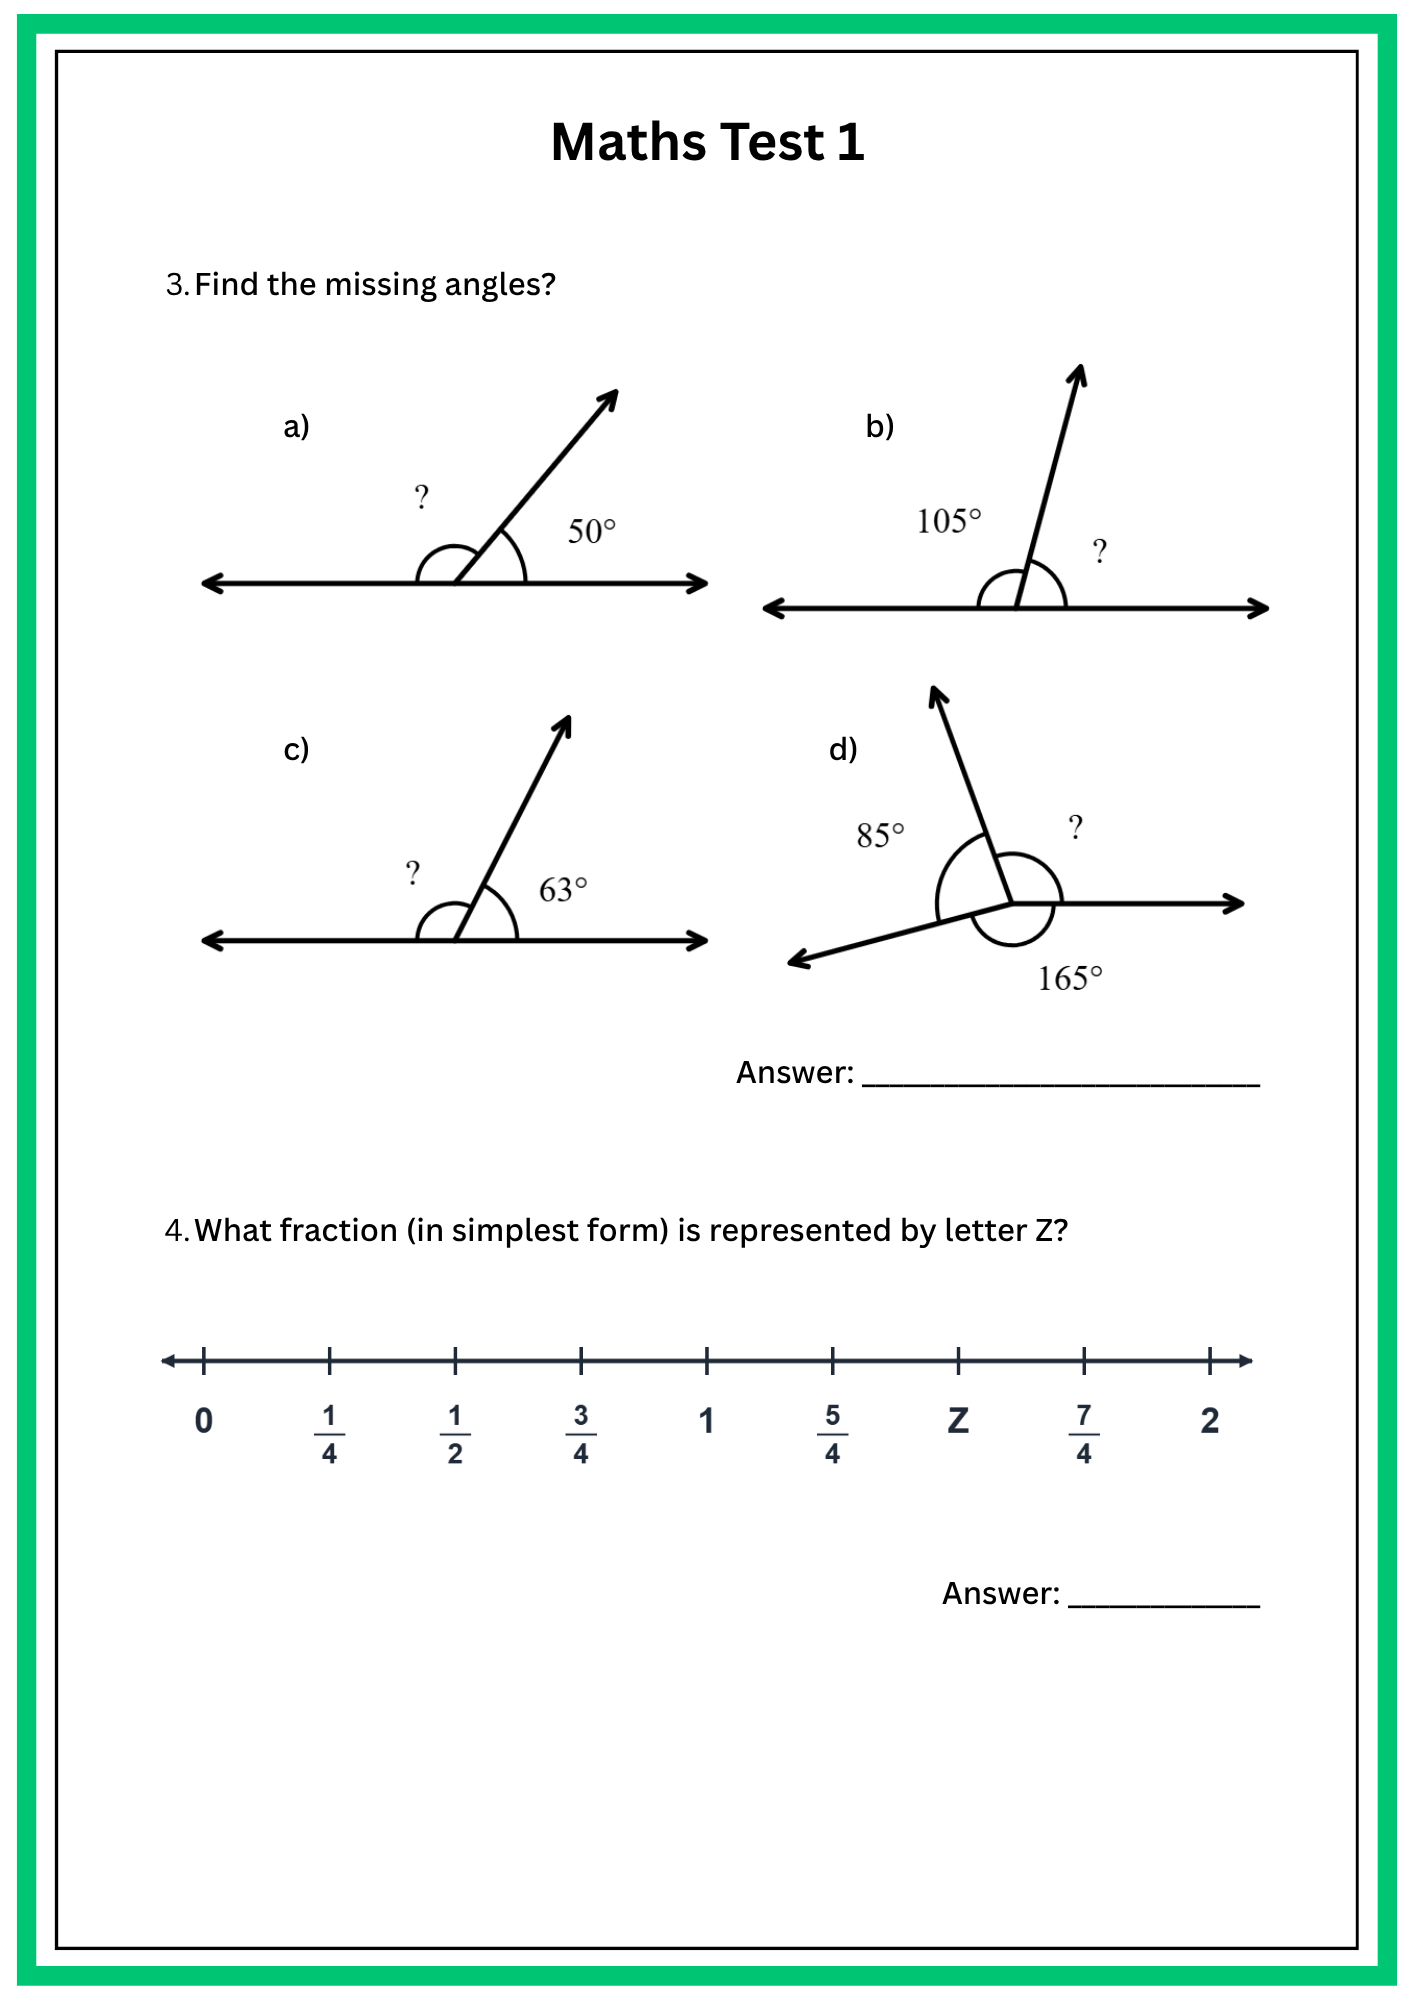
Yes. Vexplot is designed for visuals used in worksheets, lesson slides, revision notes, online learning resources, and assessment questions.